Economic GDP in Africa, Factors Behind Them.


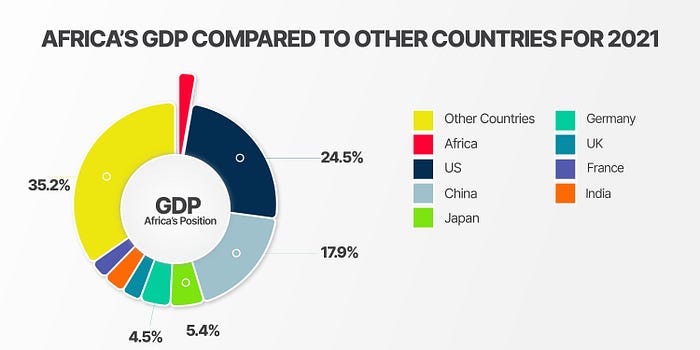
The total value of all goods and services produced within the borders of Africa by its economies were projected to be around $2.7trillion as of 2021, increasing by $296billion from 2020(STATISTIC.AFRICA.2022). While the US announced its gross domestic product for the year 2021 to be $23.00 trillion. with an increase of $2.10 trillion which is almost the entire value of Africa’s GDP, coming after the year 2020 plagued by lockdown restrictions(STATISTIC.WORLD.2022). The US undoubtedly has the largest economy in the world, maybe too much in comparison for the continent of Africa as of now, but with countries, China, Japan, Germany, the United Kingdom, India, France, and even the state of California in the US has a larger GDP than Africa. This further highlights the economic gap between Africa and other economies of the world.
According to GDP ratings published by International Monetary Fund World Economic Outlook (STATISTIC.WORLD.2022), the largest economy in Africa, Nigeria ranked 28th in the world. Despite its growth of 3.4%(AFDB.2022), it fell down 1 position on the ranking. South Africa 33rd and Egypt 36th were the only other African countries ranked within the top 50 economies. The economies of these 3 countries make up almost half of the total value of Africa’s economy for 2021. Nigeria 18.4% representing $480.4billion, followed by South Africa at 15.9% at $415.3billion and then Egypt at 15.2% at $396.3billion is 2 times more than the value of Algeria in 4th with $168billion(STATISTIC.AFRICA.2022). This also highlights the gaps between countries in Africa too. Apart from the 4 countries mentioned before, there are only 3 other countries above the $100billion mark in the continent. Northern Africa has the highest economic value in the region at $792 billion with Egypt as one of the major contributors, and Algeria and Morocco the 2 other countries with a GDP value above $100billion. Followed by West Africa at $777billion with Nigeria as the major contributor, followed by Ghana with about $75billion. The two areas combined make up about 58% of the continent’s economy. Then Southern Africa 16.79% at $452billion South Africa holding the majority share, Eastern Africa16.44% $443billion with Kenya being the only country having more than $100billion in value. Mid Africa 8.04% at $217billion make up the rest. Libya ranks 18th in Africa’s GDP and has experienced a 42.1 percent growth — the biggest GDP growth on the IMF list and South Sudan recorded -26.51% growth according to the IMF.

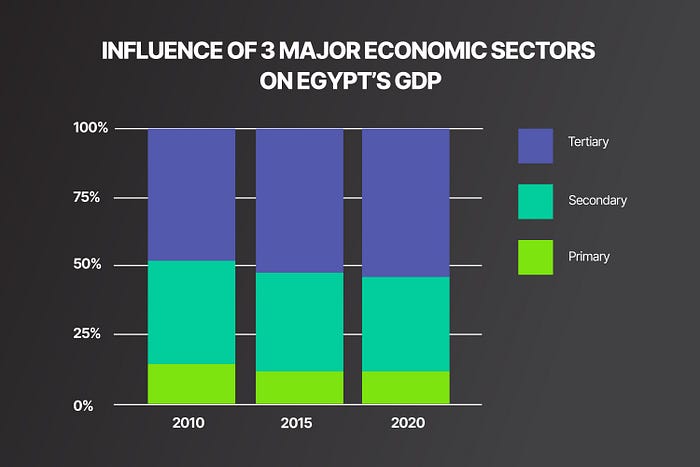
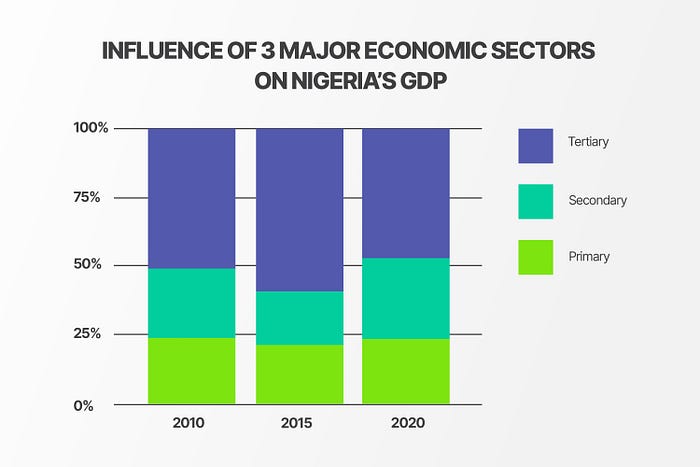
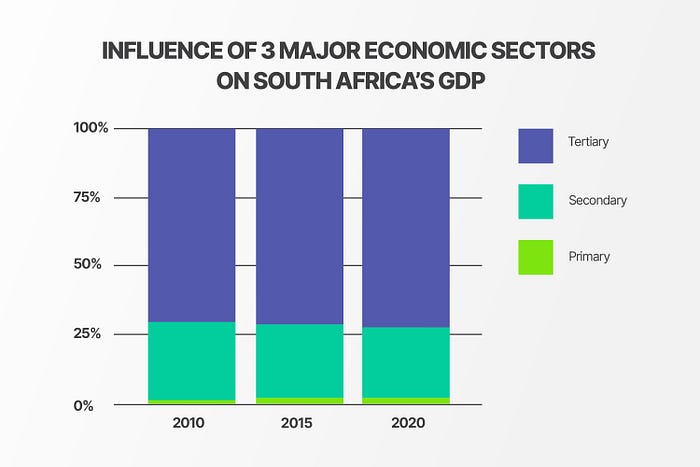
Analyzing or breaking down the various economies in Africa shows that they are driven by various sectors. Industries are divided into three categories based on the service they provide — the primary, secondary and tertiary sectors. The primary sector is focused on raw materials and resources such as forestry, and agriculture. The secondary sector can be identified as manufacturing, processing industries, and the tertiary sector which is the services sector including services like Information Provision, customer services, and banking services. Nigeria’s economic earnings from primary sources in the last 10 years has been around the 25% mark crossing into 27% in 2020, as the country’s recent drive for manufacturing power and industrialization has also pushed the secondary sector closer to 30% from 20% as of 2015. Services provision still remains the highest, although it has seen a notable drop from almost 60% in 2015 to hover around the 46% mark in 2020. Egypt’s economic strength comes from the Services sector, with the sector responsible for a little above 50% of the country’s GDP. While the primary sector has seen a decline from 2011 where it was at 13% as it sat in the lower percentile of 11% as of 2020. The secondary sector has struggled also from brushing the 40% mark in 2013 to being at 32% in 2020. South Africa’s economic strength comes mainly from the services sector. Which is responsible for almost 65% of the country’s GDP. With the country having its primary and secondary sector at less than 30% combined in the last 10 years, 2.53% and 23.42% respectively as at 2020.
Sectors are important for understanding the macro economy of a country. Investors can sometimes use this information to make decisions and develop proposals. Yet, sectors do not give enough details that an investor needs to plan out a financial program. The way in which the economy is categorized into different sectors can vary depending on the country and its policies. Sectors are only a piece of the entire puzzle. As sometimes sectioning can be misleading in certain countries, South Africa, for example, has some of its major trade material be platinum, gold, citrus, and iron ore but the services, sector registered at more than 65% of such opportunities in the primary sectors are sometimes overshadowed. The microeconomic factors that silently but influence the larger view of the economy are also needed for decision making, information like what cities are planning to do with a budget surplus for that year, their political decisions, internal security, demand elasticity, and producers' current supply rates. This information and a number of others are usually required when business proposals and investment is being considered. Rwazi as a market intelligence platform that provides multinational consumer goods and companies with actionable data from developing markets in sub-Saharan Africa, seeing the problems companies faced trying to have such information have created a community of mappers not only across Africa but Asia and South America. Making access and gathering of fresh data from markets easier while still engaging thousands of youths across these regions.
Despite the numbers and figures, the continent shows at the moment. sub-Saharan Africa's economic growth is estimated to be at 4% for 2021, almost doubling the 2% estimated as of 2020. The opportunity for spontaneous growth is high for the region should it be accompanied by economic development.
Ibukun Ayo Ogunmuko
REFERENCES
International Monetary Fund World Economic Outlook, List of countries by GDP. October — 2021. — (STATISTIC.WORLD.2022)
International Monetary Fund World Economic Outlook, List of African countries by GDP. October — 2021. — (STATISTIC.AFRICA.2022)
African Economic Outlook 2021 — African Development Bank. 2022. — (AFDB.2022)
While sectioning economies into sectors helps to give investors a basic understanding of the macroeconomy of their country of interest. It doesn’t provide as much information needed to make decisions and plan proposals on.
The economies in Africa when divided into various sectors allows for a better general understanding of what drives them.
Africa was valued at during a specific period of time, usually a year or a quarter.
In 2021, the total value of U.S. trade goods amounted to approximately 4.6 trillion U.S. dollars.
the total value of all goods and services produced within the borders of a country during a specific period of time, usually a year or a quarter.
The three countries combined represent almost half of the entire continent’s GDP. Algeria in 4th is 2 times and more less than Egypt’s.
Africa’s economies were projected to be around $2.7trillion, increasing by $296billion from 2020.
Northern Africa has the highest economic value in the region at $792 billion with Egypt as one of the major contributors, Algeria and Morocco the 2 other countries with a GDP value above $100billion. Followed by West Africa at $777billion with Nigeria as the major contributor, followed by Ghana with about $75billion. The two areas combined make up about 58% of the continents economy. Then Southern Africa(16.79%) South Africa holding the majority share, Eastern Africa(16.44%) and Kenya being the only country having more $100billion in value. Mid Africa (8.04%) make up the rest.
Africa’s economy being considered in 3 sectors, namely the;
• Primary (raw resources): agriculture, forestry, fishing,oil.
• Secondary(industrial works): Manufacturing, processing, transforming goods.
• Tertiary(Services): Information Provision, customer services, banking services, medical services.
Nigeria’s economic earnings from primary sources in the last 10years has been around the 25% mark crossing into 28% in 2021, while the country’s recent drive for manufacturing power and industrialisation has pushed the secondary sector closer to 30% from 20% in 2015. Services provision still remains the highest, although it has seen a notable drop from almost 60% in 2015 to hover around the 50% mark in recent times.
Egypt’s economic strength comes from the Services sector, with the sector responsible for a little above 50% of the country’s GDP. While the primary sector has seen a decline from 2011 where it was at 13% as it sat in the lower percentile of 11% as at 2020. The secondary sector has struggled also from brushing the 40% mark in 2013 to being at 32% in 2020.
South Africa’s economic strength comes mainly from the services sector. Which is responsible for almost 65% of the country’s GDP. With the country having its primary and secondary sector at less than 30% combined in the last 10 years (2.53% and 23.42% respectively as at 2020).